
Wildfire Image Segmentation
Github Repo: wildfire-segmentation
Authors
Department of ECE, University of Toronto
- Jia Shu (Forrest) Zhang, [email protected]
- JiaXuan Zhao, [email protected]
- Yan Zhang, [email protected]
Abstract
The escalating impacts of global warming and climate change have led to an increase in wildfire incidents in Canada, resulting in significant financial losses, compromised air quality, and causing severe threats to public health. Timely detection of active wildfires and the affected areas using satellite imagery is crucial for mitigating these negative impacts and risks. In this project, we developed a U-Net convolutional neural network model from scratch and trained it using post-fire satellite images from California wildfires, augmented with various data augmentation techniques. The trained U-Net model accurately segments the affected areas, highlighting the regions impacted by wildfires in most images. This research contributes to the advancement of wildfire detection and mitigation strategies, offering a valuable tool for early intervention and response efforts.
Introduction
In recent years, Canada has faced increasingly severe challenges due to the escalating frequency and intensity of wildfires. These wildfires have not only destroyed large areas of forests and wildlife habitats but have also inflicted significant socio-economic and environmental impacts on affected communities.
The occurrence of wildfires in Canada has become a pressing concern, under the effects of climate change and other environmental factors. For instance, the months of May and June in 2023 witnessed a notable surge in wildfire activity, marking it as one of the most severe fire seasons in history [4].The devastating consequences of these wildfires are evident in the substantial financial losses incurred, the compromised air quality that poses health risks to inhabitants, and the extensive damage inflicted on natural landscapes.
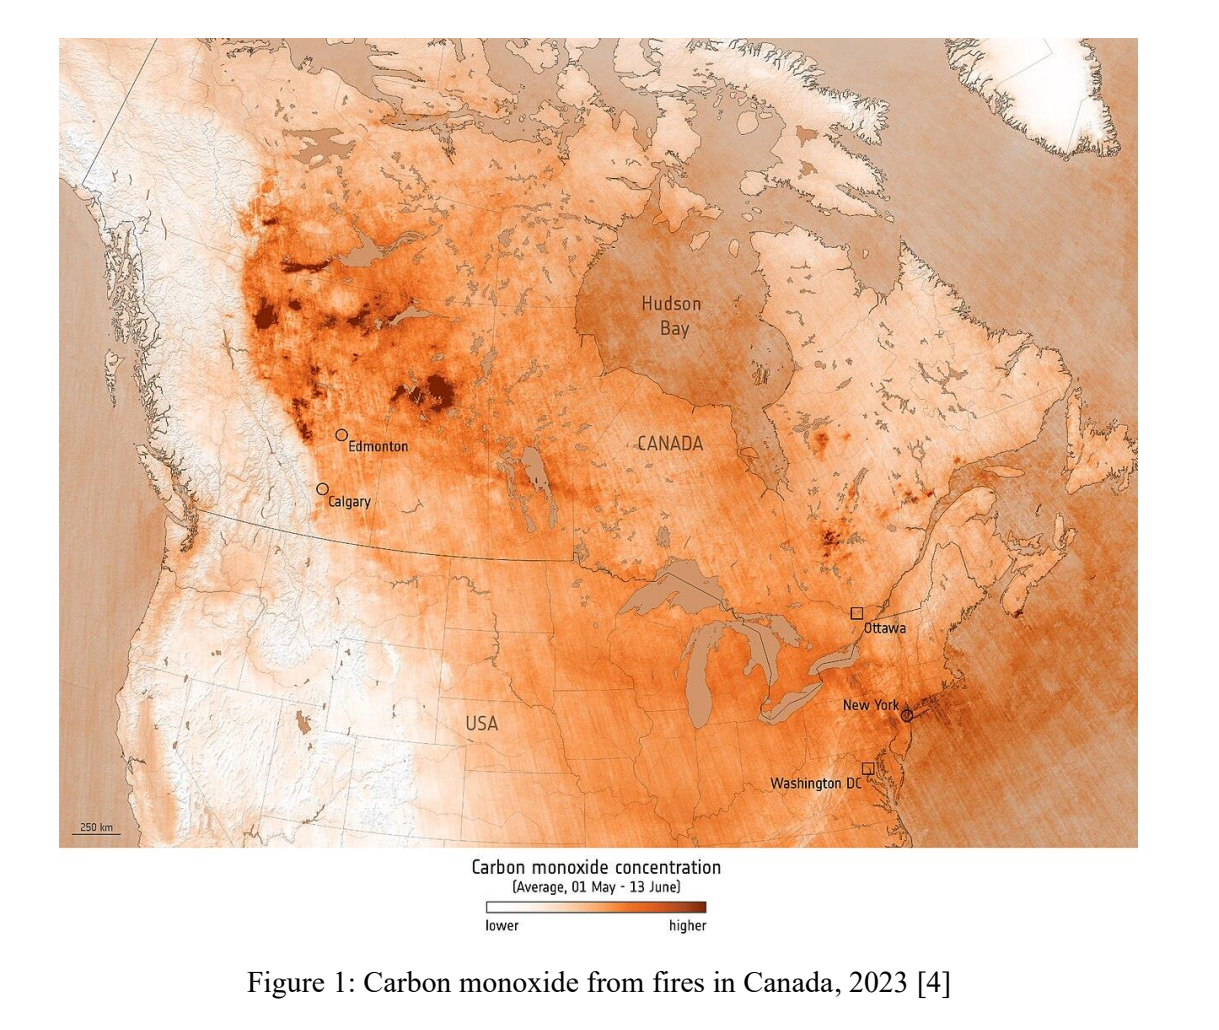
Considering these challenges, there is a growing recognition of the urgent need for innovative and effective strategies to mitigate the negative impacts of wildfires. One such strategy involves leveraging advanced technologies, such as satellite imagery analysis, to enhance wildfire detection and response efforts. Segmentation of burned areas from satellite images plays a pivotal role in this regard, offering valuable insights into the spatial extent and severity of wildfire incidents.
Segmentation of burned areas enables the accurate delineation of fire-affected regions, allowing for a better understanding of the extent of damage and facilitating targeted response and recovery efforts. By identifying burned areas from satellite images, emergency responders can prioritize resources and allocate manpower more efficiently, thereby minimizing the adverse effects of wildfires on communities and ecosystems.
Machine learning stands out as a highly effective technology for image segmentation, employing neural networks to achieve exceptional precision and efficiency. Our goal is to leverage the capabilities of machine learning and neural networks, to tackle the crucial task of image segmentation. Specifically, we aim to utilize post-fire satellite imagery to train a model capable of accurately detecting the burned regions within the images.
Problem Specification
Our project is centered around the segmentation of burned and unburned areas within satellite images, utilizing the California burned areas dataset [5] sourced from Hugging Face. To accomplish this task, we have employed the U-Net convolutional neural network (CNN) [1], renowned for its effectiveness in image segmentation. Its distinctive architecture employs both downsample and upsample paths, in which feature maps from the former are concatenated with inputs to the latter, facilitating comprehensive segmentation.
The dataset comprises of 534 pre-fire and post-fire images, along with the corresponding burned area masks. These images have a resolution of 512 x 512 pixels with 12 spectral channels. Our training approach involves allocating 80% of the data for training, 10% for validation, and 10% for testing.
We compute the loss by applying SoftMax activation at the output layer and measuring the cross-entropy loss between the predicted mask and the ground truth mask.
During the training phase, we intend to experiment with hyperparameters such as batch size, learning rate, and momentum. Additionally, we will explore different data augmentation techniques to enrich the training data set.
Design Details
Dataset
The California Burned Areas Dataset (CaBuAr) [5], a comprehensive collection of Sentinel-2 satellite imagery capturing the before and after states of areas affected by wildfires. The dataset ground truth annotations are provided by the California Department of Forestry and Fire Protection.
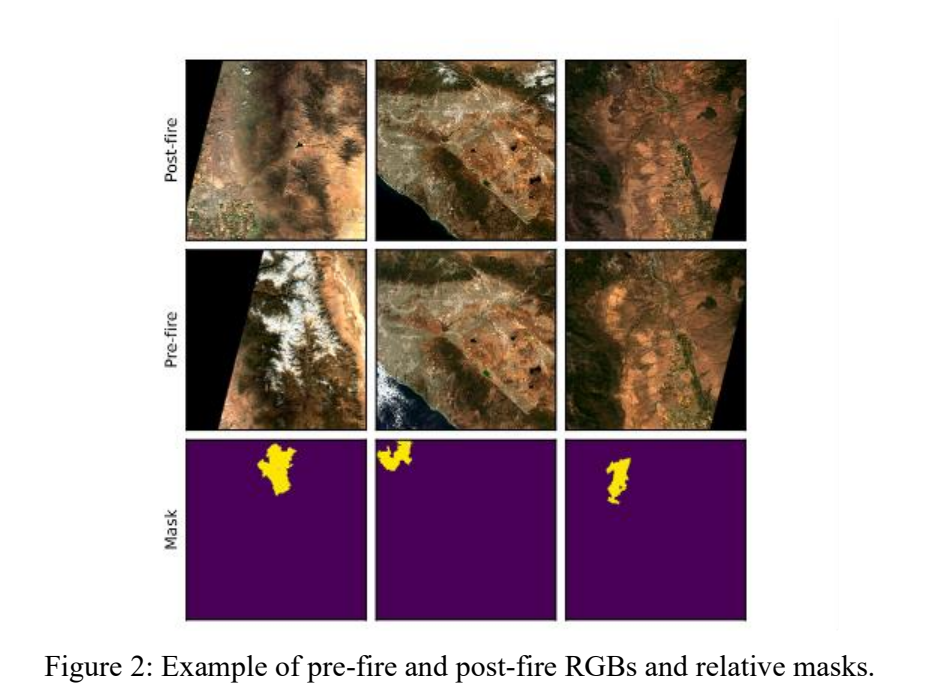
Each image matrix measures 512x512 pixels across 12 distinct spectral channels. The associated masks employ a binary classification scheme where pixels are labeled ‘1’ to denote burned regions and ‘0’ for unaffected terrain.
Our segmentation efforts concentrate primarily on the post-fire imagery, with the goal of accurately delineating the extents of wildfire damage.
Figure 2 presents a visual sampling of the dataset, showcasing the stark contrast between pre-fire and post-fire landscapes, as well as the delineated masks that highlight the afflicted areas.
Data Transforms
We apply normalization to improve the stability of the gradient descent, and data augmentation to improve the robustness of our models’ performance. For each training sample, we first apply normalization using the mean and standard deviation calculated across the entire dataset for each spectral channel. We then apply a series of data transforms to reflect a myriad of real-world variances with satellite imagery.
Augmentation: We implemented a series of transformations that randomly alter the images and their corresponding masks to augment the dataset. Below are our specific augmentation methods.
- Elastic Transformations: We introduce random elastic distortions to images and masks, simulating potential variations in the appearance of burned areas due to differing perspectives or conditions.
- Horizontal and Vertical Flips: We perform random horizontal and vertical flipping operations on images and masks on the horizontal and vertical axes, reflecting the rotational variance of natural landscapes.
- Affine Transformations: We apply random scaling, translations, and rotations, offering a comprehensive range of geometric changes to the dataset. We did this by extending the “RandomAffine” class to apply random affine transformations.
- Gaussian Noise: We apply random Gaussian noise to an image tensor. We also add random pixel-level noise to the images, simulating potential sensor noise or atmospheric interference such as clouds that could affect satellite imagery.
- Custom Color Jitter: We modify the color channels of an image tensor, altering brightness, contrast, and saturation to mimic the varying lighting conditions under which the satellite images may be captured.
Network
We implemented U-Net [1] in PyTorch for this image segmentation task. We utilized the basic structure and methods of the original U-Net; however, we modified the channel size of the initial input layers to accommodate our dataset. The network structure is shown in Figure 3.1.

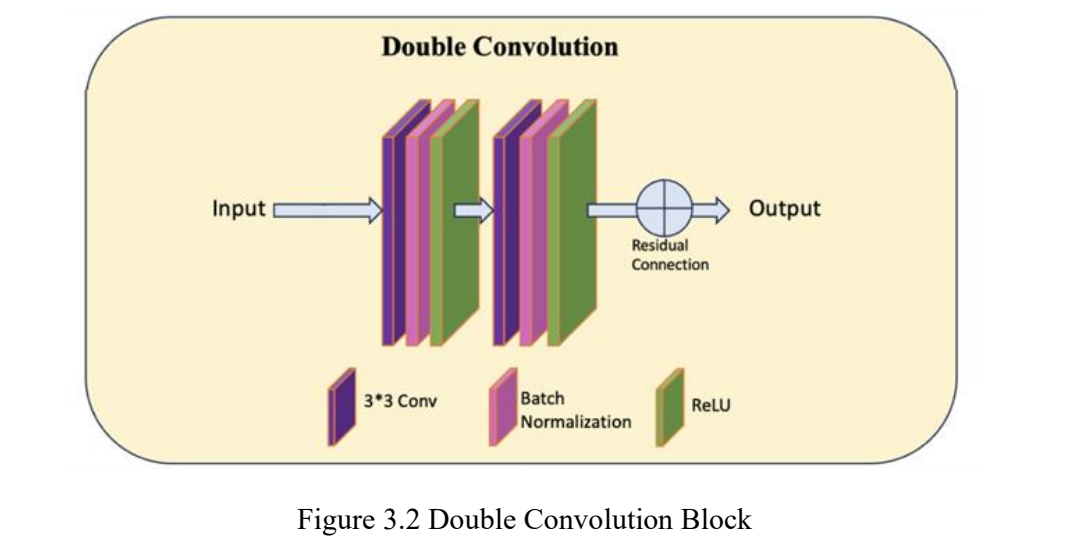
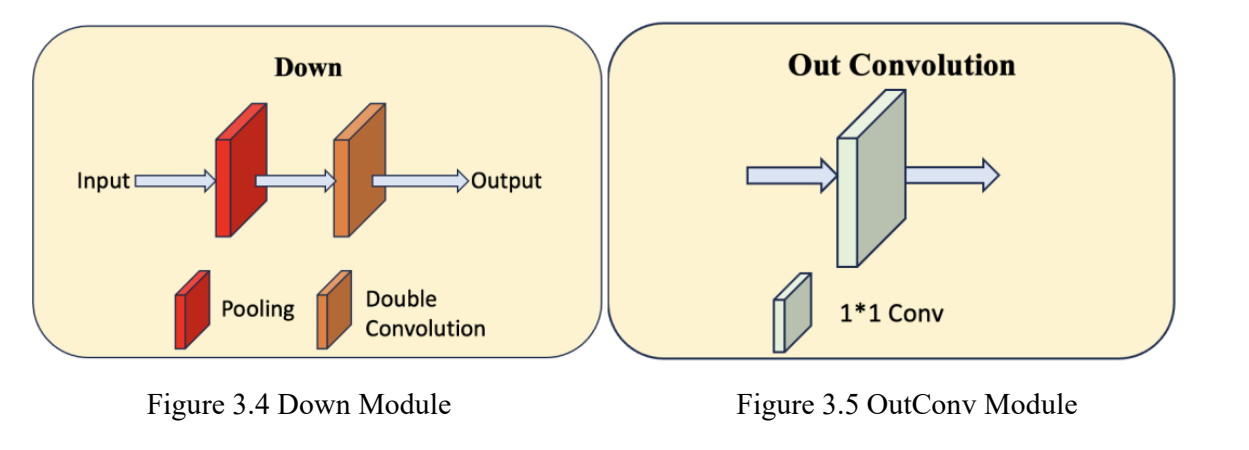
The network is comprised of a contracting and expanding path. The contracting path on the left accepts an input image, which first passes through a “DoubleConv” module (Figure 3.2). The resulting feature map is then progressively downsampled with repeating “Down” modules (Figure 3.4). Each “Down” module halves the spatial dimensions and doubles the feature channels. This allows the network to form a rich, abstract representation of the input data.
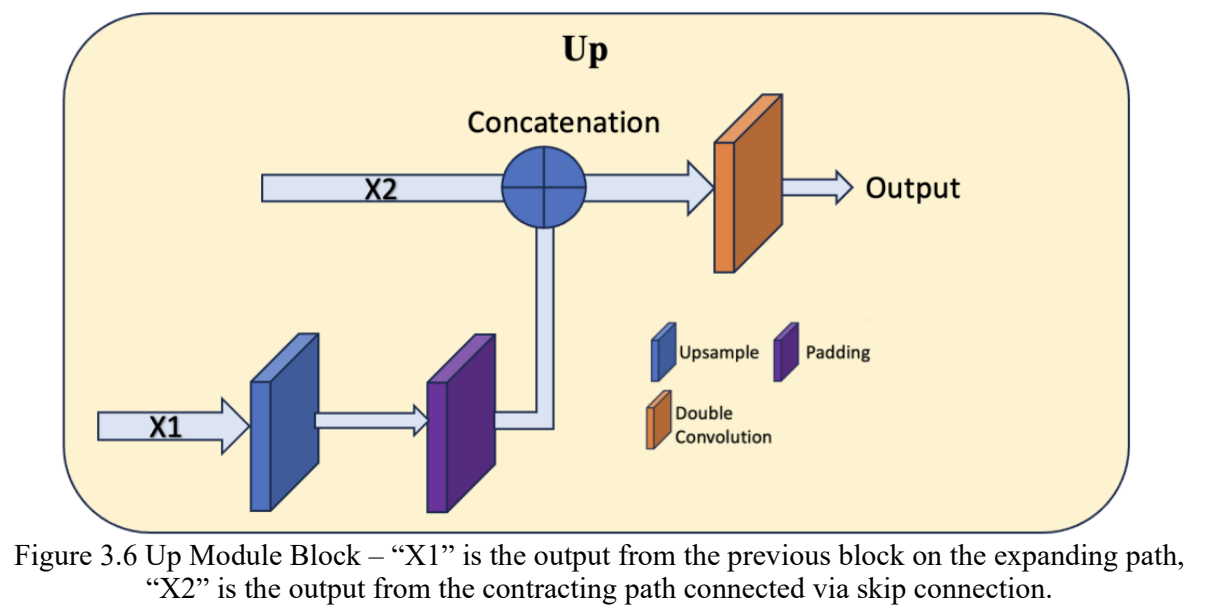
After the contracting path, the model transitions to the expanding path. This path is comprised of a series of “Up” modules (Figure 3.6) which incrementally restore the image resolution. These modules utilize upscaling techniques and concatenate features from the contracting path, ensuring the retention of critical spatial details. This multi-directional flow of information, facilitated by skip connections, is intrinsic to U-Net’s design, enabling the synthesis of local and global image characteristics.
The process culminates in an “OutConv” module (Figure 3.5) that consolidates the learned features into a singular output mask, representing the segmented regions of interest.
We further implement the attention gate mechanism to augment the original U-Net, and we have also implemented dropout between the two paths to increase robustness. These additions were not originally in our project scope. Our implementation and result for implementing attention gate and dropout is shown in Appendix B.
Training
Our neural network model is trained using the Adam optimizer, selected for its gradient scaling capabilities. The loss is computed using PyTorch’s “BCEWithLogitsLoss”, which combines a sigmoid layer and the binary cross-entropy loss in one class. It serves as our criterion, chosen for its numerical stability with logits output. Model states and metrics are logged during training for monitoring and evaluation. The states are checkpointed at specified intervals, allowing for recovery and resumption of training.
Numerical Experiments
Experiment Setup
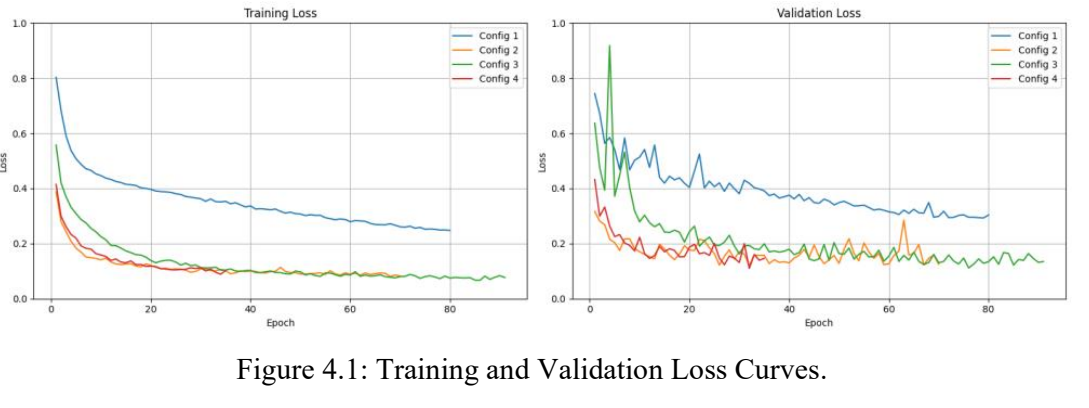
We trained the U-Net on the Post Fire dataset with varying configuration of learning rate, batch size, and L2 regularization. The values for each configuration are listed in table 1. We train the models for each configuration until the validation loss converges.

Hyperparameter Selection
We iteratively tuned the learning rate, batch size, and L2 regularization after each run.
After the initial run with Config. 1, we noticed that the loss curves descended slowly, and that the validation loss started to flatten before the training loss, suggesting that the model is beginning to overfit. We decided to increase the learning rate on subsequent runs for a steeper curve, and to add L2 regularization to combat overfitting.
For the subsequent runs, we noticed that the higher learning rates lead to large fluctuations in the loss curves between epochs. We increased the batch size in Config 4. to reduce gradient noise, however, we were unable to train that model for many epochs due to hardware limitations.
Please see the Appendix for more exploratory configurations that we attempted.
Model Validation and Performance Metrics
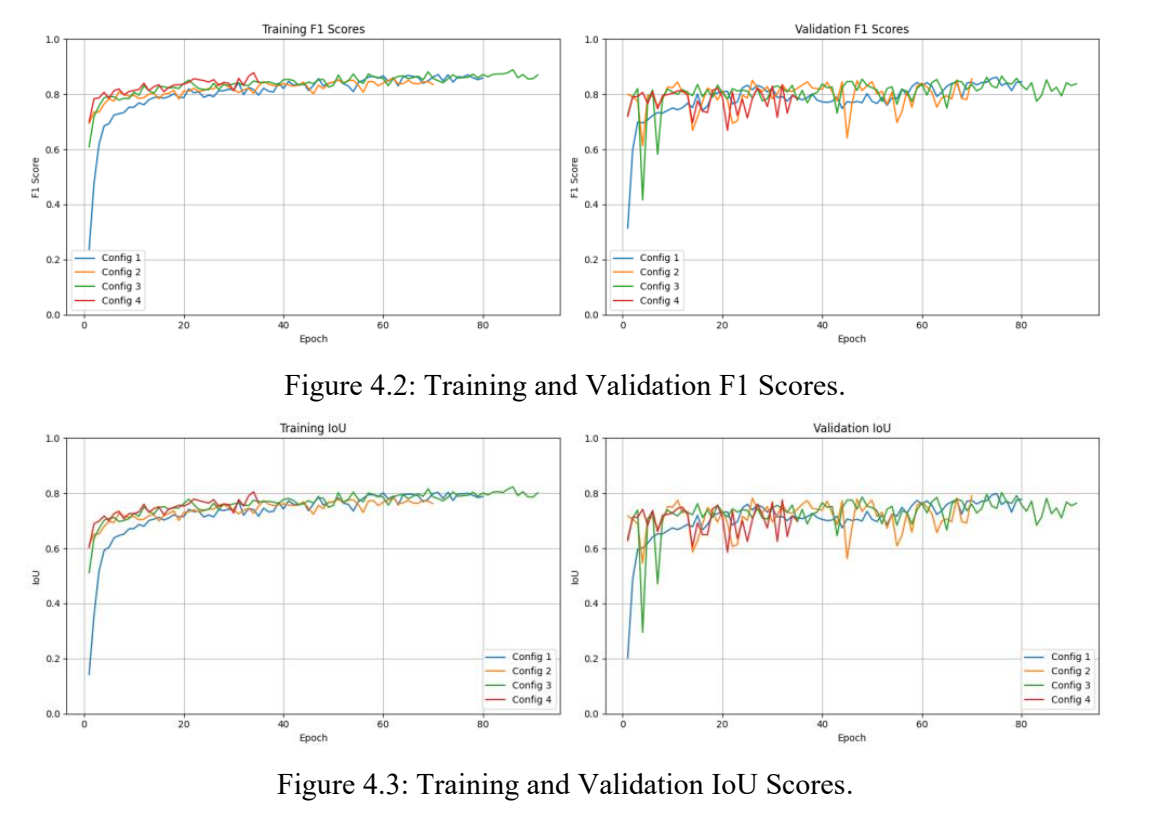
Model performance is quantified using metrics from the scikit-learn library. After each training epoch, the model undergoes validation, where the F1 and IoU scores are calculated to measure segmentation accuracy. These metrics are calculated with predictions threshold at 0.5.
Model Evaluation
The plots for the training and validation F1 and IoU scores are shown in figures 4.1 – 4.3. Additionally, the F1 and IoU scores of each model for the reserved test dataset are shown in Table 2.
Results
Configuration 3 produced our best model, with a test F1 score of 0.8355 and IoU score of 0.7536. This is an improvement compared to the U-Net implementation in the CaBuAr paper [5], with a F1 score of 0.707 and IoU of 0.583.
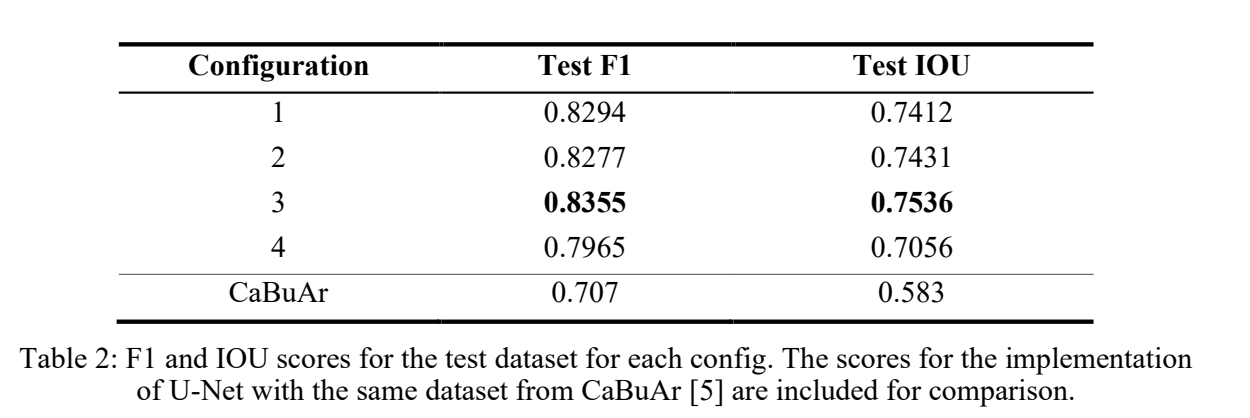
The difference is likely due to our data augmentation and hyperparameter tuning that allowed for better generalization, as the original dataset is small.
Model Outputs
Figure 4.4 shows the image, ground truth mask, and predicted mask for 3 samples taken from validation and test datasets. The predicted masks are generated with the model we trained for configuration 3.
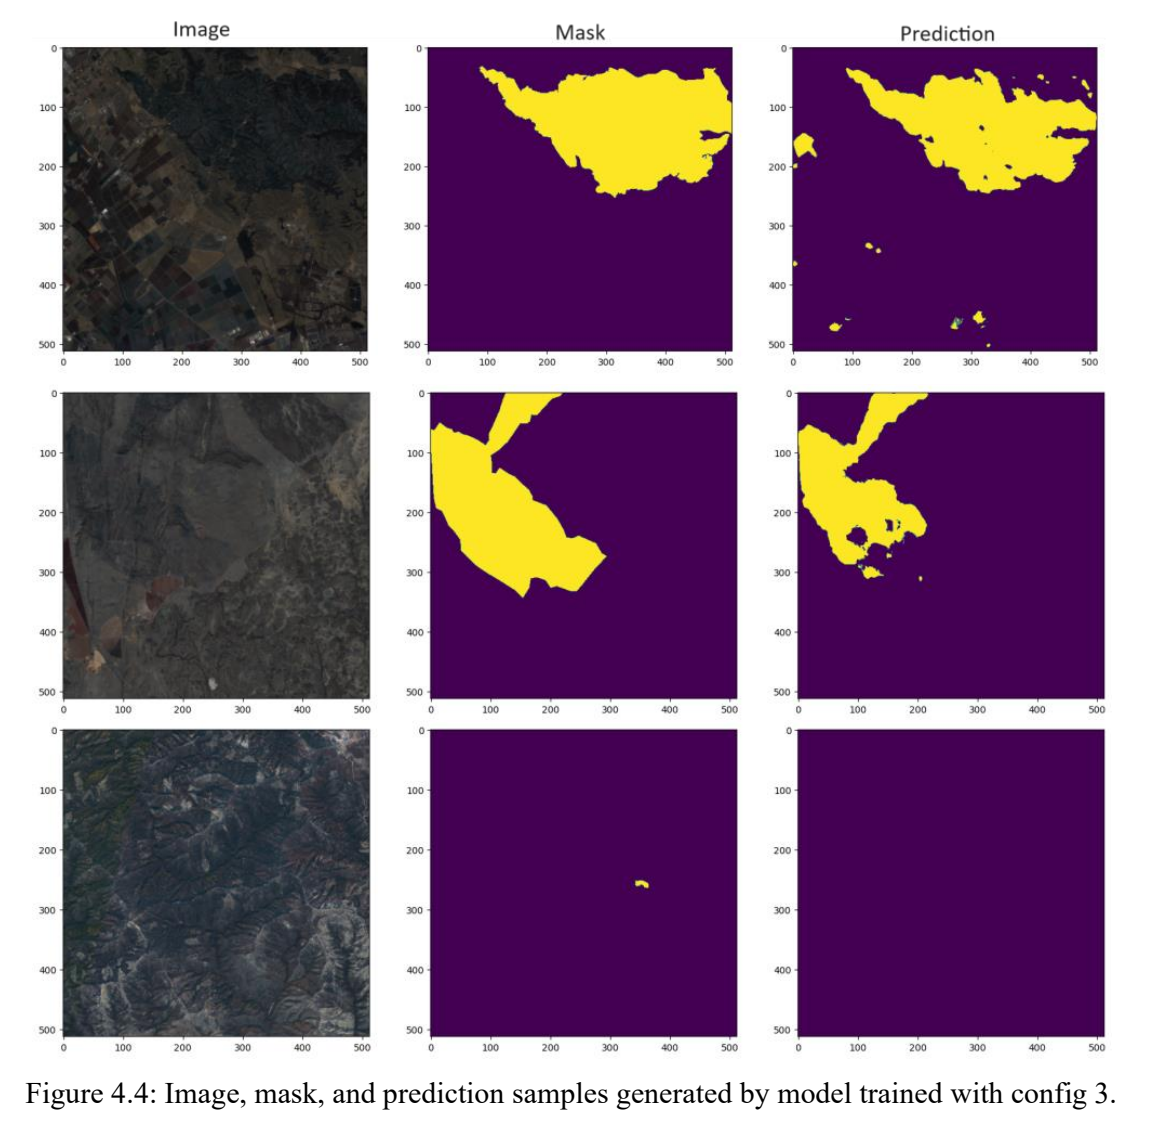
The model can predict the general areas affected by wildfires but has difficulty with the mask boundaries and small instances of burned land.
We hypothesize that this is due to our ground truth mask having equal weight during training for the entire mask. This incentivizes the model to spread out the mask predictions rather than keeping the predicted sections together.
The uneven boundaries may also be due to the regularization that we applied during training. The penalty may have led to weights that are further from extreme values, which led to predictions that are more scattered.
Conclusions
Through the implementation of this project, we explored different neutral networks for image segmentation and understood their respective strengths and limitations. Through the process of data preprocessing, we have gained a deeper understanding of the significance of data augmentation, particularly in scenarios where dataset sizes are constrained. Processing satellite imagery presented unique challenges, especially when dealing with the 12 spectral channels. We encountered limitations with existing image transformers in PyTorch, which primarily support 3 color channels. In this case, we must develop customized augmentation functions for both images and masks.
As we progressed to the training stage, we encountered new challenges related to computational resources. The substantial memory requirements associated with training images of dimensions 512 x 512 x 12 necessitated access to large GPU memory. Additionally, the extensive data augmentation processes imposed considerable time overheads, further highlighting the resource-intensive nature of the task.
As for further enhancement, we plan to investigate the integration of attention gates into our model architecture. These attention mechanisms can augment our model’s sensitivity to specific regions within images, thereby refining the segmentation process for heightened precision. Additionally, we aim to incorporate dropout regularization techniques during training. By randomly deactivating neurons during training, dropout helps prevent overfitting and enhances the generalization ability of the model. Furthermore, we intend to conduct experiments with different threshold values to fine-tune the delineation of segmented regions and explore the utilization of weighted masks to augment our model’s sensitivity.
References
- [1] R. Olaf, F. Philipp and B. Thomas, “U-Net: Convolutional Networks for Biomedical Image Segmentation,” in MICCAI, 2015.
- [2] X. Tete, L. Yingcheng, Z. Bolei, J. Yuning and S. Jian, “Unified Perceptual Parsing for Scene Understanding,” in European Conference on Computer Vision (ECCV), 2018.
- [3] X. Enze, W. Wenhai, Y. Zhiding, A. Anima, M. A. Jose and L. Ping, “SegFormer: Simple and efficient design for semantic segmentation with transformer,” Advances in neural information processing systems 34, pp. 12077-12090, 2021.
- [4] G. o. Canada, “Canada’s record-breaking wildfires in 2023: A fiery wake-up call,” Government of Canada, 2023. [Online]. Available: https://natural-resources.canada.ca/simply-science/canadas-record-breaking-wildfires-2023-f iery-wake-call/25303.
- [5] D. R. Cambrin, L. Colomba and P. Garza, “CaBuAr: California Burned Areas dataset for delineation,” IEEE Geoscience and Remote Sensing Magazine, vol. 11, pp. 106-113, 2023.
- [6] ESA, “Carbon monoxide from fires in Canada,” 15 6 2023. [Online]. Available:https://www.esa.int/ESA_Multimedia/Images/2023/06/Carbon_monoxide_from_fires_in_Ca nada.